 That old transport paradigm, the one we are still living with today, is far too narrow in terms of the range and quality of people targeted and services offered, and in the process fails to serve what is -- in fact -- the transpiration majority.
The “transportation majority” is not what most people think, transportation planners and policy makers among them. The transportation majority are all those of us who increasingly are poorly served by the mainline service arrangements that eat up most of our hard-earned taxpayer money and fail to offer them acceptable and efficient choices that mesh with their special needs and circumstances. And each year as our populations age this majority grows in numbers.

Here is a generic short-list of the people who make up this till-now all too silent, substantially under-served majority:
- Everyone in the city or region who does not own or have handy access to a car
- Everyone who suffers from some form of physical or other impairment that makes driving or even access to traditional public transit difficult or impossible
- Everyone who cannot drive
- Everyone who should not drive, ever (for reasons of a variety of impediments such as limitations associated with age, psychological state , eye site, reactions times, , , ,)
- Everyone who cannot responsibly take the wheel at any given time (fatigue, distraction, nervousness, some form of intoxication. . . )
- All those of us who cannot afford to own and operate a car (and this is a very big number indeed)
- Everyone who lives in a large city and for reasons of density, public health and quality of city life needs to have access to a decent non-car mobility system
- All of those — a fast growing group — who would in fact, given the choice, prefer to get around by walking, cycling or some form of active or shared transport, but who cannot safely or readily do so today — because the money is being spent on the vehicle system which is fundamentally, and financially, incompatible with these “softer” and more healthy ways of getting around
- All those of us who are isolated and unable to participate fully in the life of our communities because we simply do not have a decent way to get around.
- And so — don’t lose sight of this! – in a few inevitable years, you and me!
Do the numbers and you will see that this is a very sizable group, a significant and growing majority in fact, and we can know several important things about them in the policy context. The first is that high quality public transport is one important lifeline for them
But the second is that they represent a highly diverse collection of individuals: they are not a "mass" and their needs are personal and disparate. Beyond that, it also needs to be taken into consideration that many of their needs cannot be entirely served at appropriate levels of convenience and cost by mainline public transport alone.
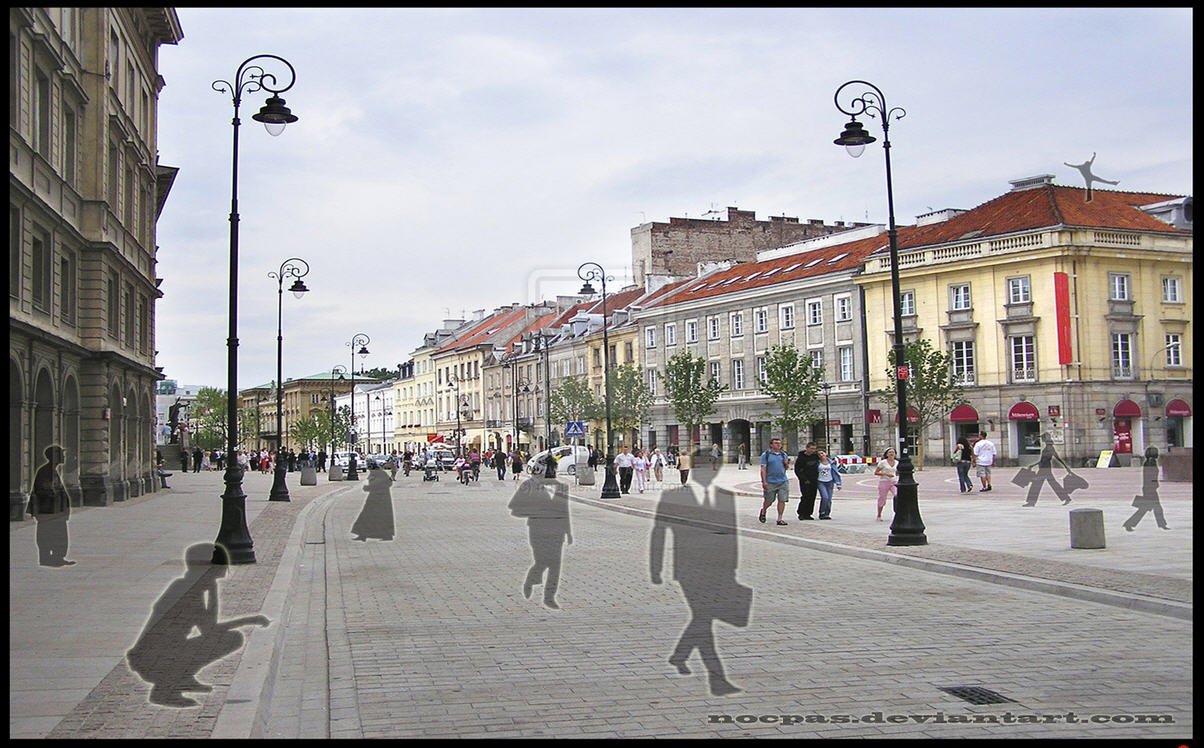
But the killer is that these people, their unmet needs, are for the most part invisible. Since they are not able to get around they simply fall off the radar screen of planners and policy makers and are left, abandoned and unserved. This is neither equitable nor worthy of a democratic society.

Fairness in a Car Dependent Society (UK perspectives)
By way of an independent checklist of sorts, here are the seven underserved groups set out in the recent report: "Fairness in Transport – Finding an alternative to car dependency" prepared and published by the British Sustainable Development Commission. (Copies of the full report are freely available here - http://www.sd-commission.org.uk/publications.php?id=1184)
These positive and negative impacts are unevenly distributed. Seven key groups have been examined:
- Low income;
- Children;
- Clder people;
- The disabled;
- Black, Asian and minority ethnic groups;
- Rural communities;
- and Future generations.
The review of evidence underpinning this report revealed a number of key findings:
1 Whilst over 80% of households have a car, one in five men and one in three women do not drive.
2 The richest 10 per cent of the population effectively receive four times as much public spending on transport as the poorest 10 per cent.
3 Children of the lowest socioeconomic groups are up to 28 times more likely to be killed on the roads than those of the top socioeconomic group.
4 The most common cause of death for children aged 5-14 years is being hit by a vehicle.
5 Car owners in the lowest income quintile spend 25 per cent of total household expenditure on motoring. (By comparison spending 10 per cent of income on household energy bills is defined as ‘fuel poverty’).
6 Black and brown British people have amongst the lowest car ownership rates, while in London, for example, they are 30 per cent more likely to be injured on the road than white ethnic groups.
7 Those in the top income quintile travel two and half times as far as those in the bottom income quintile and three times as far by car. In the lowest income quintile, less than half of adults hold a driving licence and less than half of households have a car whilst half of all households in the highest income quintile have two or more cars. For those claiming income support or jobseeker’s allowance, car access figures are even lower – almost two thirds do not have access to a car and a licence to drive it.
8 Those over the age of 60 are seven times more likely to be killed if hit by a car at 30 mph and 35 per cent of all pedestrian fatalities are people over the age of 70.
9 People living in rural areas now see car ownership as a necessity and around 90 per cent of households have at least one car. The cost of motoring was found to account for 60 to 100 per cent of the additional income calculated as being required for rural dwellers to meet a minimum socially acceptable standard of living commensurate with urban dwellers.
10 55 per cent of trains in use in Great Britain have not been built to modern access standards and 41 per cent of stations do not have step free access to all platforms. 39 per cent of buses do not have accessibility certificates.
Our analysis demonstrates that existing transport patterns in the UK contribute to substantial and persistent inequalities. Some people benefit from accessing a wide range of education and employment opportunities and goods and services, whilst others are held back, unable to access the opportunities that would enable them to maximise their own wellbeing and social and economic contribution.
The inequality is two-fold. In general the people experiencing the worst access opportunities also suffer the worst effects of other people’s travel. They are both ‘less travelled’ and ‘travelled-upon’. The evidence we present in this report suggests that the central reason for this inequality is society’s dependence upon the car as its dominant mode of travel. Put simply, increasing car dependency has led to increasing unfairness.
A new approach to transport policy is badly needed – one which accommodates complexity, works intelligently with social and environmental impacts, and takes a system-wide view. We need to move away from ‘predict and provide’ for powered transport (including rail and aviation) and work instead towards policy choices that are guided by a vision of a sustainable transport system.
PS. And because it is important to put human faces on those who are badly underserved by present arrangements, we shall here present a certain number of profiles, testimonials of people who explain to us what the problem is. We definitely need to get better at listening. And at using our eyes.

# # #


No comments:
Post a Comment
Thank you for your comment. You may wish to check back to the original entry from time to time to see if there are reactions to this. If you have questions, send an email to: editor@worldstreets.org